Using SPSS for Windows for Data Analysis
TV Viewing Survey

Please ask a varied sample of people the questions below and
record their answers on these forms.  Please do NOT hand out
the forms.

1.  Approximately how many hours of TV do you view on an

    average weekday? ____

2.  How many hours of TV did you view yesterday? ____

3.  What is your favorite TV program?  _______________
    (any series or special from any season, NO feature films)

4.  Who is your favorite TV character?  _______________
    (does NOT have to be from 3)

5.  How old are you?  ____

- - - - - - - - - - - - - - - - - - - - - - - - - - - - - -

6.  Please record the subject's sex:  M ____  F ____
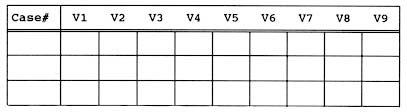
Once the data were collected, responses were coded using the coding sheet shown below. Unless you are collecting machine readable data such as responses on a Scantron sheet or direct keyboard input by your subjects, I recommend that you transfer your raw data from the survey forms to a coding grid sheet similar to the one used here. The instructions at the top of the coding sheet correspond to what the authors of our text call the code book. For simple studies, I find it helpful to print these right on the code sheets.
TVR 400 Coding Sheet, TV Viewing Survey

Variables & Values
V1: avday ___
V2: yest ___
V3: type; 1=Soaps, 2=Sitcom, 3=Drama, 4=NewsInfo, 5=Other
V4: csex; 1=Male, 2=Female
V5: ctype; 1=Real, 2=Fantasy
V6: age ___
V7: agex; 1=0-12, 2=13-18, 3=19-24, 4=25-54, 5=55+
V8: rsex; 1=Male, 2=Female
V9: year; 1=1994, 2=1996, 3=1998, 4=2001, 5=2003
Note that even for this simple study, coding can be a problem. For avday and yest you just enter the number, with two decimal accuracy if necessary. The variable type, however, requires some value judgments. It is a good idea to use outside coders, and have them work in small groups, or have them code a few of the same items independently and test for intercoder reliability.
While you may code nominal variables with letters (i.e.: M=male, F=female), I recommend you use numbers for two reasons. First, some programs which you may use in the future will not recognize alphabetical coding. Second, it is faster and easier to enter a long list of data using the numerical keypad provided on most computer keyboards. Reports can still be printed with the actual values labeled.
Once your data are coded, you are ready to enter them into SPSS for Windows. SPSS stands for Statistical Package for the Social Sciences and it has long been the standard in both social and biomedical research. The full version with all of the optional "plug-ins" will cost in the thousands of dollars, but a student version is available from the campus bookstore for under $100 which will handle all the basic statistics needed for an MS thesis. The student version 11.0 was used to prepare this handout.
In this handout, variable names will be printed in bold face, lower case (SPSS will force lower case for the main variable names, which cannot exceed 8 characters). Menu items to be selected by clicking will be underlined, and the names of boxes to be checked, or into which you can move variables using an arrow, will be designated by being placed in "quotation marks." Column names generated by the SPSS program will shown in Italics.
On the computers in LC 213 (the Conference Room), double click on the SPSS icon (a red triangle). A wizard-type window will open on top of the program asking you what you want to do. If you are creating a file for the first time I find it easiest just to close that window by clicking on the "Close" box (marked with an X) in the upper right hand corner of the window.
This will leave you with a spreadsheet-like grid. At the bottom of your screen are 2 tabs for Data View and Variable View. Click on Variable View so that you can create your variables.
Variable numbers will appear on the left, with 10 columns labeled across the top. These are designated: Name, Type, Width, Decimals, Label, Values, Missing, Columns, Align and Measure.
In the Name column list the variables using the names on the coding sheet (can be up to 8 letters, all lower case). In the Label column you will be able to give longer descriptions of the Variable names which will be used in printouts of your results.
I recommend giving your variables as short names as possible, so long as you can identify them later. I add an x after the name of a continuous variable I have artificially divided into discrete values (hence agex).
In the Type column you must click on the right side of the cell and choose from a laundry list of variable types. Virtually all variables will be either Numerical (for any coding system using numbers) or String for coding systems using letters or words for values. The default Width for Numerical variables is 8 and the default Decimals is 2. You can change these in the appropriate boxes within the Type pull-down or you can set them in their respective columns. If you are coding nominal or ordinal data with numerals, set the Width just wide enough to accommodate the largest number of categories you can imagine coding (usually 1 or 2). For these variables set the Decimals to 0.
For interval and ratio level variables, leave the Width set at 8 and the Decimals set at 2. The program actually performs all calculations to 8 decimal places, but for entry or display on the Data View screen, it is cleaner to restrict data to 2 decimal places.
In the Label column, type in a more descriptive name for the variable, keeping in mind that it should still be as short as possible to keep your printouts manageable.
In the Values column the default is None and this is what you want for interval or ratio level data where the actual values are recorded directly into the program. For nominal and ordinal variables, however, we want to tell the program that a code of 1=male or a code of 3=drama. Just click on the right side of the cell and a pull-down menu lets you enter all the Values (the numbers you coded) and corresponding "Value Labels," which, like variable names, should be kept as short as possible.
The default under the Missing column is None and this is probably the best setting for most variables, as the program will figure out the best way to handle missing values for each statistical analysis you run.
The Columns setting is irrelevant in Version 11.0, but in earlier versions of SPSS it sets the width of the columns displayed in Data View. I recommend setting this value at 6 to allow your variable names to be displayed in all versions of SPSS.
The default for the Align column is Right for numerical variables and Left for string variables. I recommend setting it to Center for string variables and leaving it at Right for numerical variables. It only affects how your data will be displayed in the data editor, so it really isn't critical how you set it up.
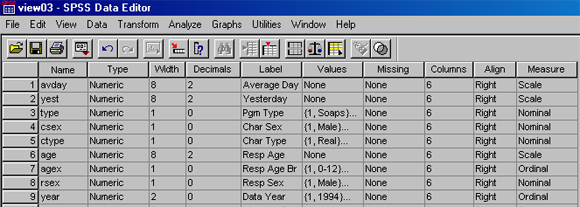
While I'm not sure how it affects your data analyses, I suspect that the Measure column is very important. When you click on this cell, a down arrow appears which activates a pull-down menu including: Scale, Nominal and Ordinal. Select Scale for any interval or ratio level variables and Nominal or Ordinal as appropriate for "category" variables. The image below shows the Variable View after our 9 coded variables have been entered.
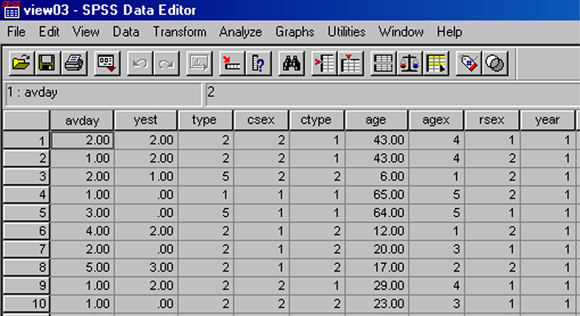
Now we are ready to enter data from our coding sheets. Simply click on the Data View tab at the bottom of our screen and you will get a blank grid with case numbers down the left side and your short variable names across the top.
While you could enter data vertically, entering each subject's values for the first variable, and then the second, etc., most researchers prefer to enter data by case. This is done by clicking on the first cell, entering the appropriate code, and then pressing TAB. When you get to the end of a case, TAB takes you to the next case automatically. Be sure to just tab over cells for which you have missing data. These can NOT be coded as zeros! The image below shows the Data View of the screen with 10 cases of our data from the viewing survey already entered.
Once all of our data are entered we could begin analysis, but there are several additional steps we may want to take first to aid the process. The two most important data manipulation commands are found under the Transform menu at the top of the SPSS screen. They are Compute and Recode. Note that these commands only work on data already entered in the data set. Enter all of your data before using any data manipulation commands!
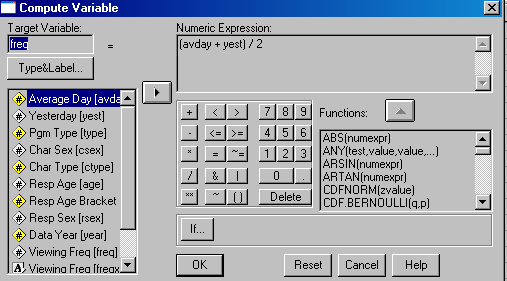
Compute allows us to create new variables based on mathematical manipulation of the data contained in our existing variables. For the sample data, we may want to create a new variable called freq (Viewing Frequency) which is an average of avday and yest values. This is done in some real studies because it tends to minimize the influence of memory and unusual life events to give a more accurate picture of typical viewing frequency.
To compute this new variable click on Compute from the choices on the pull-down menu accessed from the Transform button at the top of the SPSS screen. A dialog screen opens that allows you to place variable names in a mathematical equation. We want to add the values for avday and yest and then divide the total by 2. The image below shows this dialog box ready to create our new freq variable.
Recode can be used in several ways, but it is most often used to create a new variable which divides a continuous variable into discrete increments. We could have used it to create agex from the information subjects gave us under age.
Since we coded agex manually, let's create a new variable called freqx which divides viewing frequency into 3 values, Low, Med, and High. This will allow the continuous variable, freq to be used in crosstabulation. From eyeballing the data I have chosen to code 0-1.9 hours as Low, 2-3 hours as Med and 3.1-24 hours as High.
We could create numerical codes in the new variable, freqx, and create labels for them, but to demonstrate string values I have used the words "Low," "Med" and "High" as the actual values. Finding that SPSS always arranges string values in alphabetical order, I went back and changed the names to "1Low," "2Med" and "3High" so that our printouts will be arranged in logical order.
Choose Recode from the Transform pull-down menu and then select Into Different Variables from the slide out menu. The image below shows the dialog boxes used to create the freqx variable.
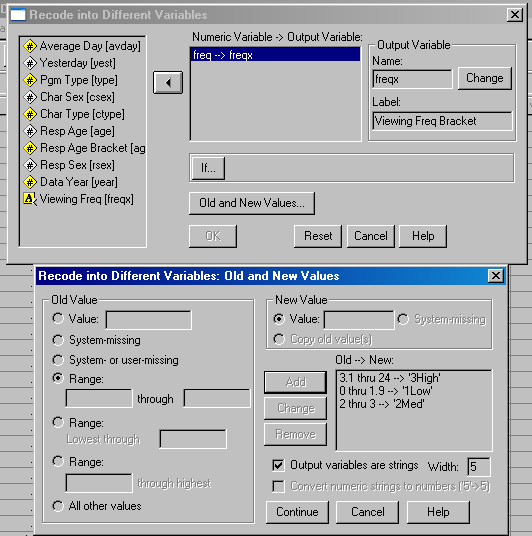
Note that you must check the "Output Variables are Strings" box to create values which are words. You should also set the "Width" box at this time to equal the longest value string (I think 8 is the longest allowed).
Now we are ready to do some data analysis.
We can print out all of our raw data by simply selecting the Data View tab and clicking on the Print button on the SPSS toolbar. If we want to list all values for only certain variables, this feature is available by clicking on the Analyze button in the SPSS main menu and selecting Reports.
The simplest statistics we may want to use are descriptive, which are appropriate for interval and ratio level variables. Our only two ratio variables are age and freq, so let's look at them. Click on Analyze in the main menu and select Descriptive Statistics from the pull-down menu. From the choices then shown, select Descriptives. Under Options you will find that mean and standard deviation are the defaults. Place checks in the boxes associated with any other statistics you would like and then click OK.
The output below was created by selecting most of the options under Descriptives and entering the variable names age and freq.
Next we might want to do a Pearson's Correlation Coefficient for the same two variables (the only interval or ratio level variables in our study). We can run this test by clicking on the Analyze button in the main SPSS menu, selecting Correlate from the choices and then selecting Bivariate. Simply move the appropriate variables into the box at the right. The Options generally are set where you want them, but be sure to choose whether you want "One-tailed" or "Two-tailed" probabilities displayed by checking the appropriate box. The output from a correlation between age and freq is shown below.
A t-test is used to compare the means of two groups on some interval or ratio level variable. We can compare freq of the two sexes of respondents using this statistic. In the language of SPSS we are doing an independent samples t-test (because no one can belong to both coding groups, male and female) and we are using rsex as the coding variable. To accomplish this, click on Analyze in the main SPSS menu and then select Compare Means and Independent Sample T-Test. Use the arrow to move freq to the "Test Variables" box and rsex to the "Grouping Variable" box.
The output of this t-test is shown below. SPSS prints out so much information that I had to cut off some extraneous data on the right to get the output to fit on your screen.
Analysis of Variance (ANOVA) works much like a t-test, but allows us to compare the means of more than 2 groups of subjects, and to compare several independent variables (if we have enough subjects, which we often don't). We might use ANOVA to see how freq (our only continuous variable that can be a dependent variable) relates to favorite type of program (type), which has 5 possible values.
To do this, click on the Analyze button in the SPSS main menu and then select Compare Means and One-Way ANOVA. Use the arrows to move freq to the "Dependent List" box and type to the "Factor" box. The resulting output is shown below.
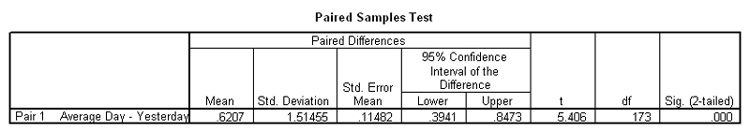
One other common statistic which SPSS will compute is a related t-test, also called the t-test for paired data. This is the appropriate test for analyzing pre-test, post-test data. Our sample study does not really lend itself to this type of analysis, but we could look at the relationship between subjects' viewing frequency yesterday (yest) and on an average day (avday) to see if these are significantly different. Since these are two separate estimates from the same subjects, the related t-test is the appropriate statistic to use.
To accomplish this, click on Analyze in the main SPSS menu and select Compare Means and Paired-Samples T-Test. Use the arrow to move the two variables, avday and yest, into the "Paired Variables" box. Then just click OK to get the output shown below.
Finally we come to crosstabulation. Crosstabulation allows you to compare any two nominal/ordinal level variables and obtain a Chi Square statistic which can help determine the significance of any relationships found. It also produces a table which helps you see where the variance is located!
First click on Analyze from the SPSS main menu, then select Descriptive Statistics and Crosstabs. Use the arrows to move any two nominal variables into the "Row(s)" and "Column(s)" boxes. Arrange the table so it will fit on your page. The Chi Square statistic will be exactly the same whichever way you arrange the variables.
Next click on Statistics and check the "Chi Square" box. Then click on Cells and check the boxes to select both "Row" and "Column" Percentages. Keep in mind that this first run of your data is for your information, not for the finished tables to be included in your paper. Until you examine the data analysis, you won't know whether your data will make more sense with row percentages, column percentages, or just actual frequencies reported. This is why I recommend that for now you set the program to give you all 3 types of output, but you would never use both row and column percentages in a final paper. SPSS can be used to quickly recreate any tables you want for your paper, which can then be copied to the Clipboard and pasted directly into Word documents.
The output of a crosstabulation between rsex and type is shown below.
Once you have a good report on screen, you can print it by clicking on the Print icon in the SPSS toolbar. More elegant output is possible using reports, but that is beyond the scope of this handout.
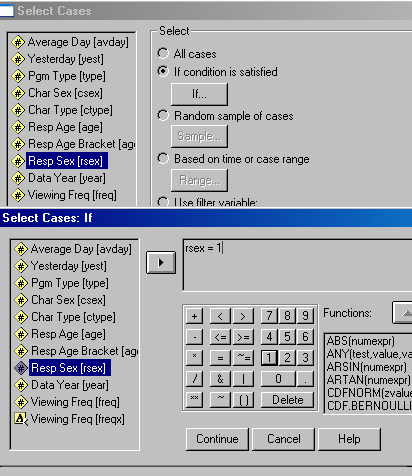
There is one more data manipulation command that you may need to use as you refine your data analysis. You may want to do a simple multivariate analysis by partitioning the subjects based on one variable and then analyzing another. For example, to factor out the influence of gender, you might want to run a t-test of freq with ctype for just the male subjects, and then a second t-test for just the females.
This is easy to do with the Select Cases feature found under the Data pull-down menu from the SPSS main menu bar. There are a variety of ways to temporarily select a subset of cases. The dialog boxes which will select just male subjects are shown below.
It's probably a good idea to run every relationship you can think of and print out the results for leisurely consideration. To save your data file, select Save As from the File menu on the main SPSS menu bar. If you are using a University computer, be sure to select Drive A: and insert a floppy disk in the appropriate drive. Choose a folder and give the file a name just as you would any other Windows file. Then click on Save.
To exit the program, click on the "Close" box in the upper right hand corner of your screen. If you have made changes to your data since saving, you will be prompted to save your data. You may also be asked if you want to save your output windows. In general these can be recreated so easily that it is not worth saving them, assuming you have printed anything of interest.
If you saved your data on a floppy disk, remember to remove the disk from the computer and keep it in a safe place.
Power up the computer and let it boot to Windows before inserting your floppy disk. Once Windows is loaded, insert your floppy disk (if appropriate) and double click on the SPSS icon. The opening, wizard-like screen will allow you to open any data files created recently on that machine. If using the same computer which created the data file, just double click on the appropriate file name.
If your file name is not displayed, close the opening window by clicking the "Close" box and then use the Open File icon to search for your file and open it in the same manner as any other Windows file. Then conduct your anaylsis and save your data following the steps previously described in this handout.
